

The Sitting Hun
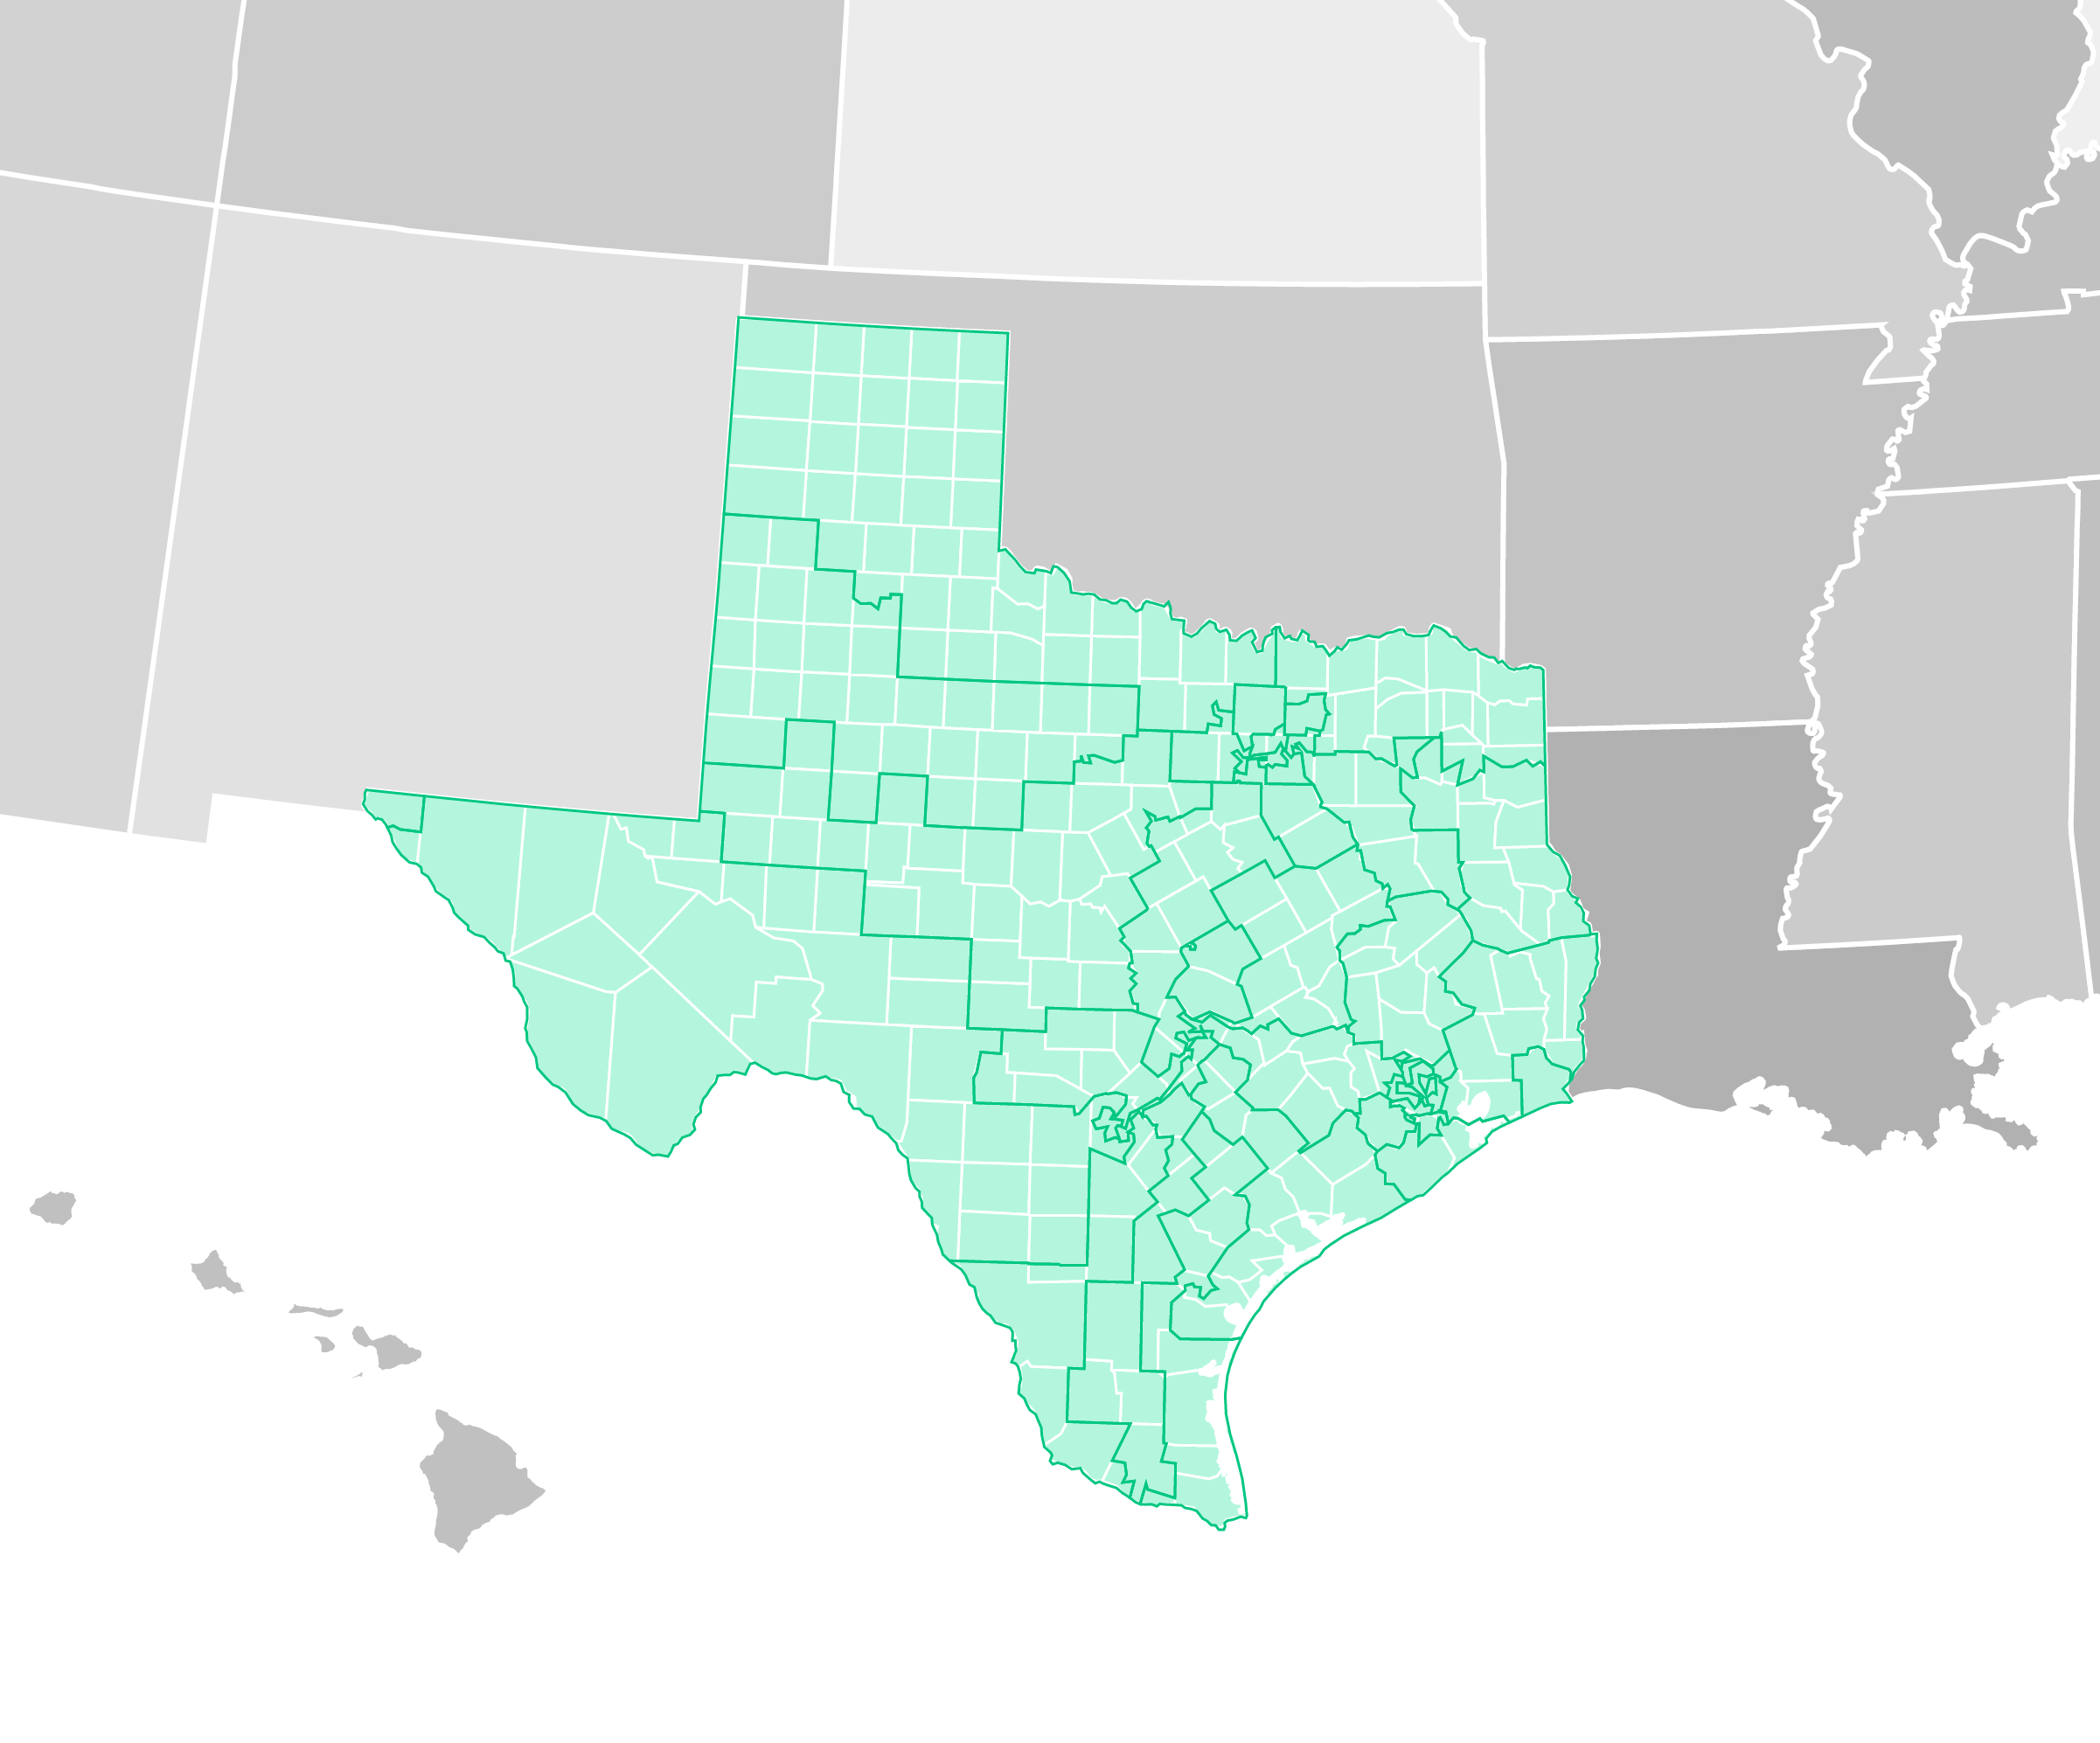
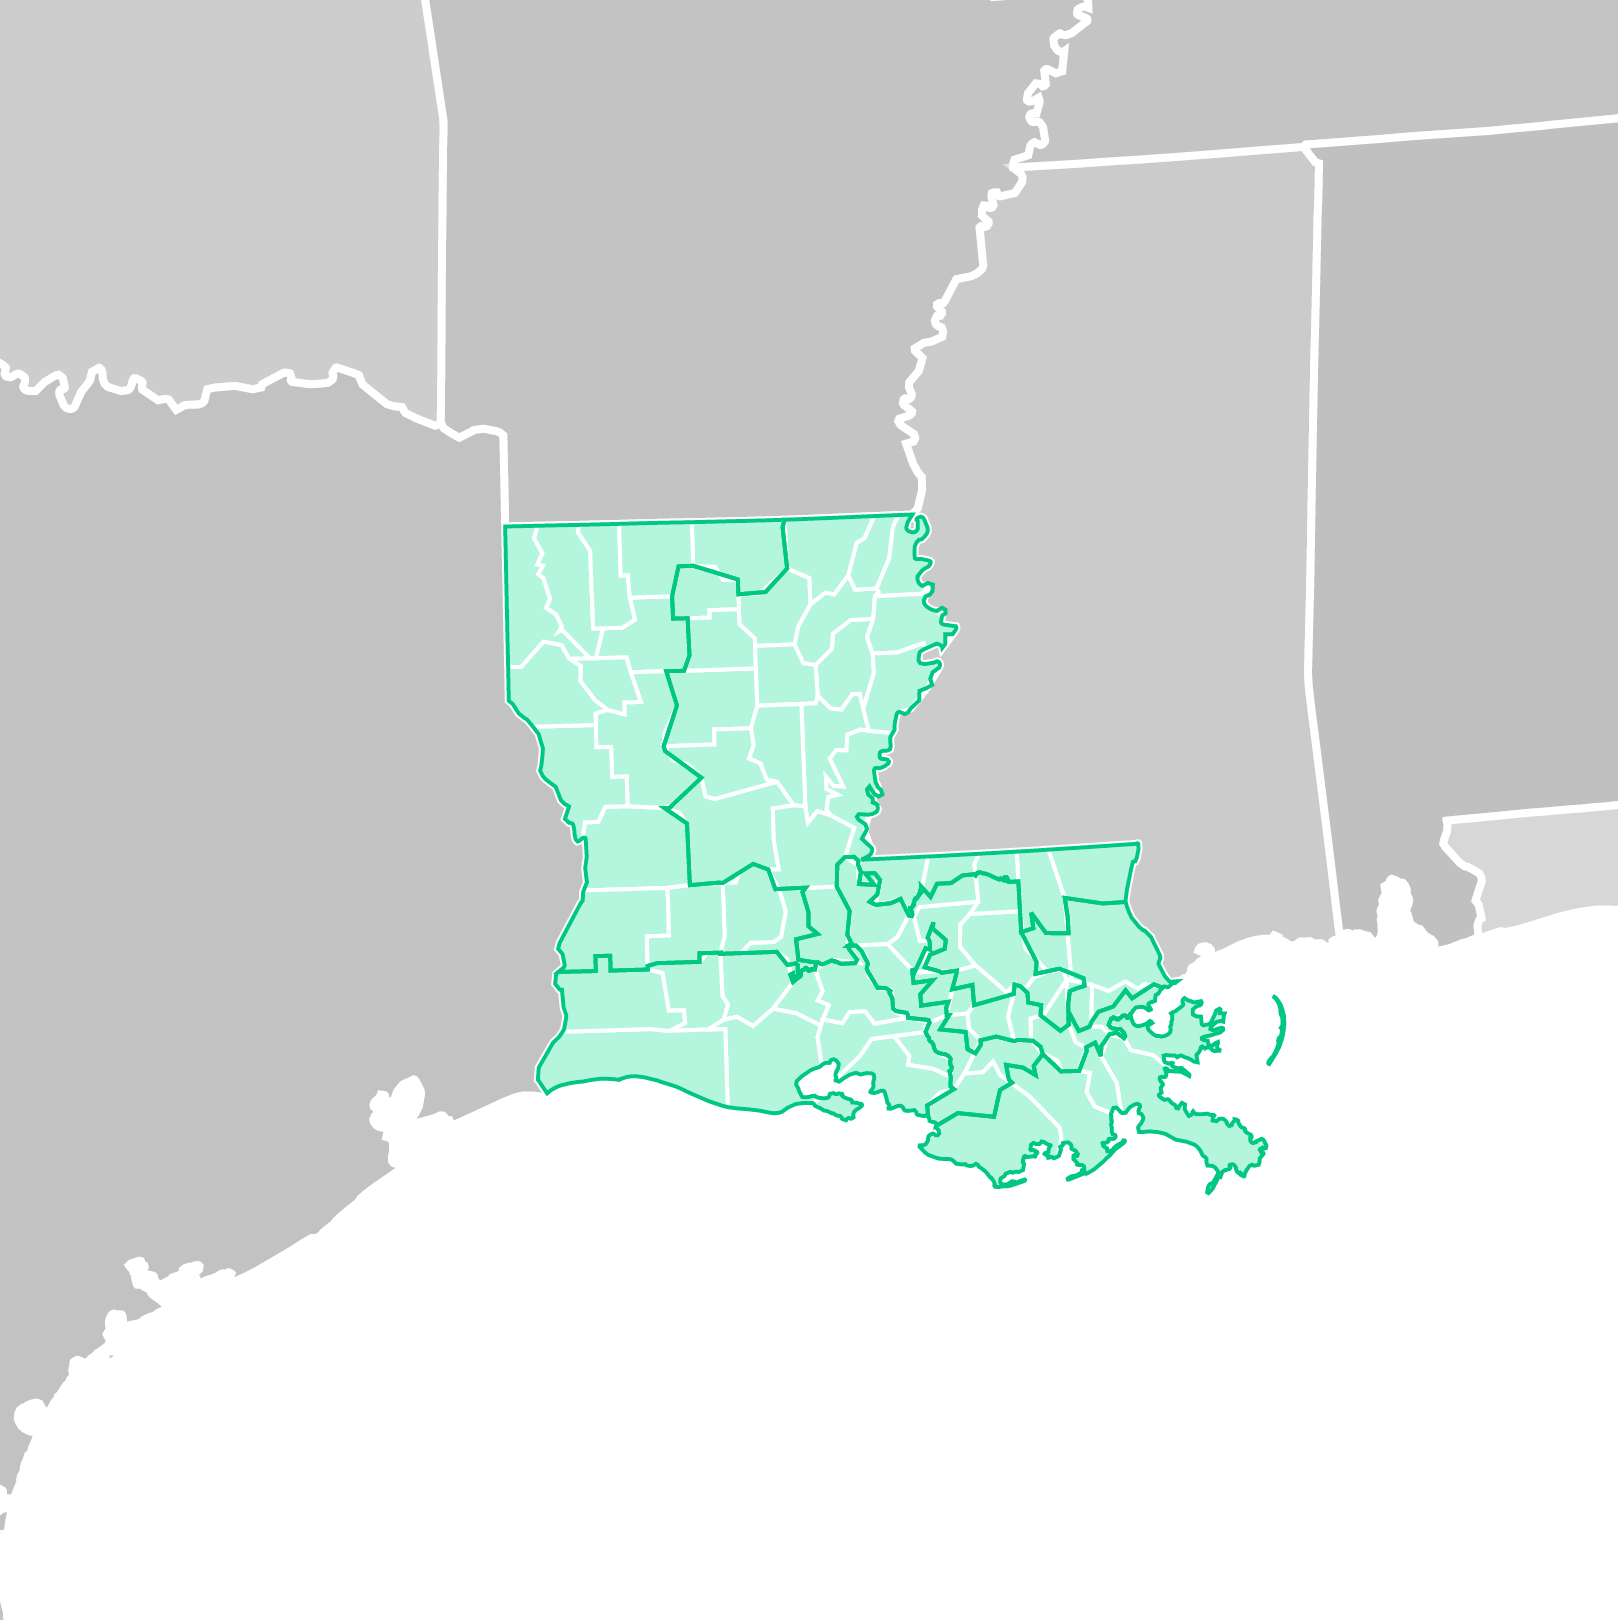
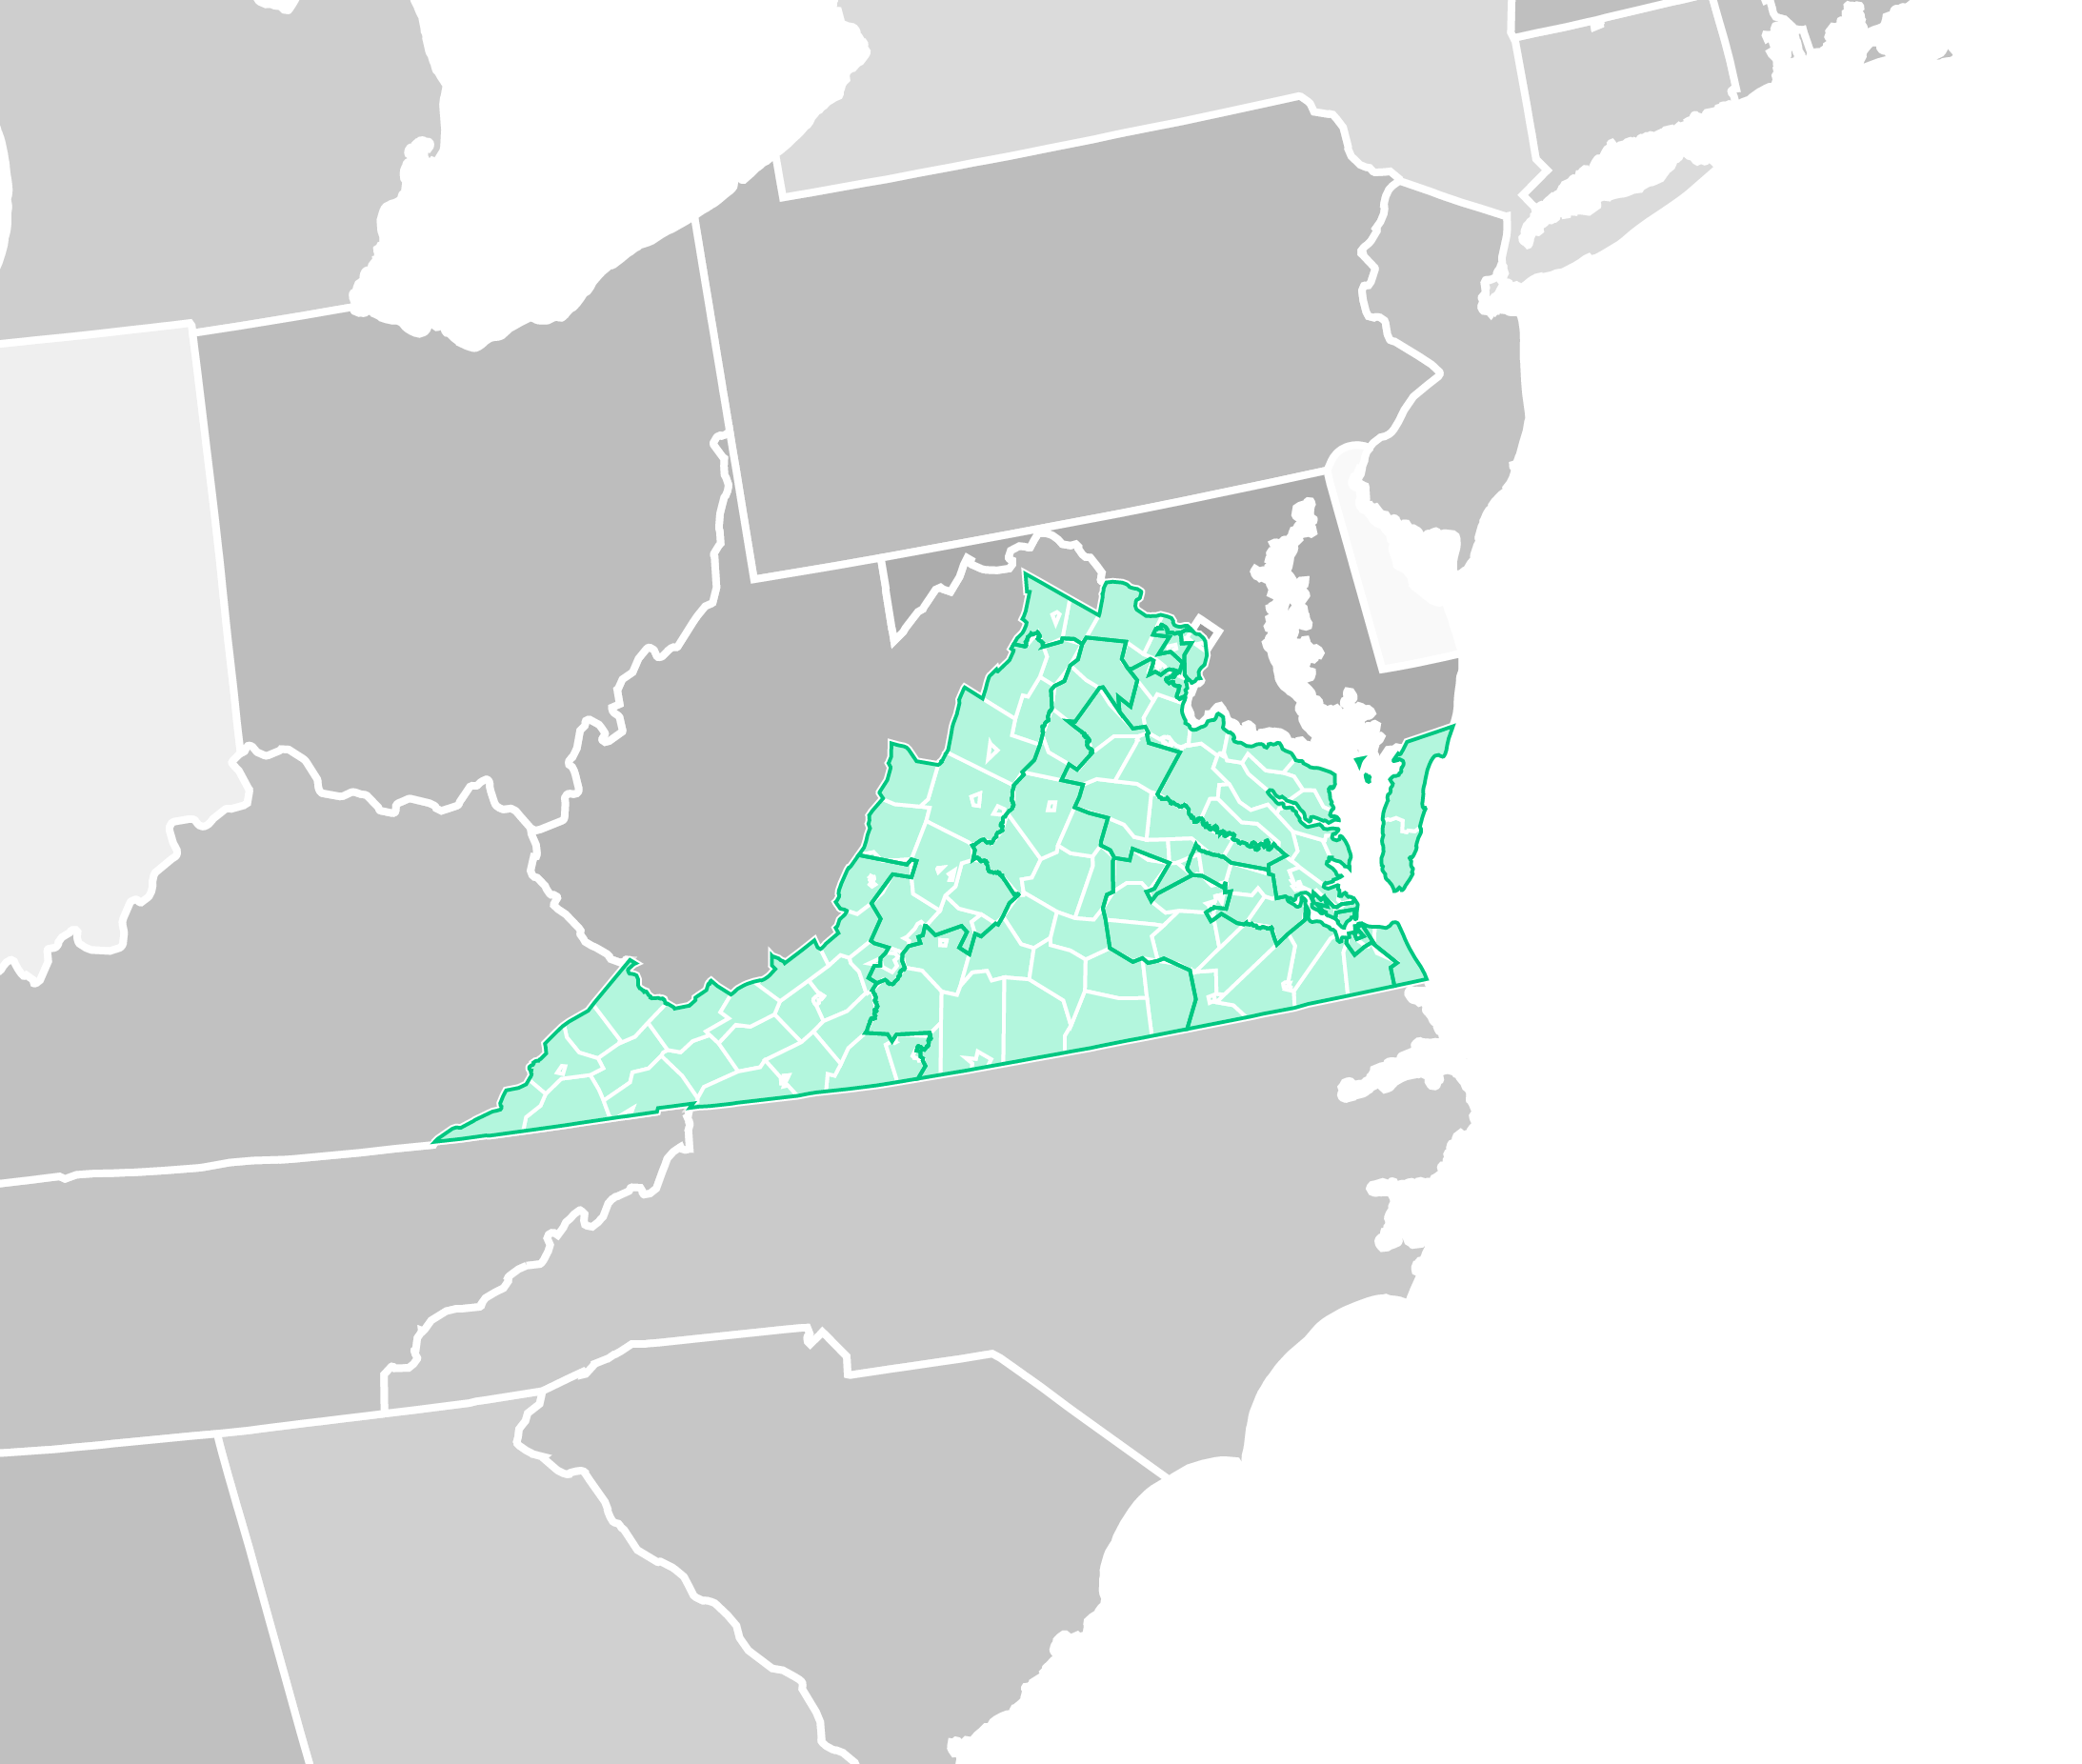
The Interactive District Map is a D3 visualization of congressional districts throughout US history. This was designed to show the effects of gerrymandering.
The project began as a way of converting congressional data into vector shapes for an animation, in collaboration with Vann R. Newkirk II at The Atlantic. I kept tinkering with it, and turned it into a fully interactive tool for people investigating gerrymandering. Explore the full visualization here.
02.05.2018